Data Table
This article describes the Date Table component and its properties.
Who can use this feature?
All Squirrel365 plans include the Data Table component.
For more details, see our pricing comparison matrix.
Squirrel 1.12 introduced a “Quick Set-up” tab on many property panels. The properties described on this page are available on the “All Properties” tab of the property panel. For more details on “Quick Set-Up” properties see this article
The purpose of the Data Table component is to show a graphical representation of some or all of the contents of the Squirrel project spreadsheet on the canvas of the same Squirrel project.
Data Table Properties
The Data Table component properties consist of LAYOUT & POSITIONING, GENERAL, TABLE STYLING, DATA INSERTION, and DYNAMIC VISIBILITY sections.
This guide will describe all sections besides the Layout & Positioning and Dynamic Visiblity sections, as these are generic to each component. A separate guide and tutorial for each can be found by clicking the links above.
The component properties are set and edited using different methods, some have multiple methods, some just one. See this Set Property Values article for more information on using the different methods.
GENERAL

Data to Display – Bind the Data to display property to a cell or range of cells in the spreadsheet. The range of cells must be continuous.
Fix header row when scrolling – If the cells bound to the Data to Display property include a header row and you want that header to remain visible when the content is scrolled vertically, check the Fix header row when scrolling checkbox.
Ignore blank – If you don’t want any empty rows or columns (at the end of the Data to Display range) included in the data table, keep the Ignore blank Rows and Columns checkboxes checked. Suppose the spreadsheet is subsequently updated and data is inserted into those previously empty rows or columns. In that case, the data table component will also update to include those previously ignored rows or columns. The image below illustrates how empty columns have been included in the Data to display range:

TABLE STYLING

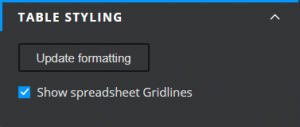
Update formatting – If you change the format of some of the data in the spreadsheet, for example, you may make the contents of a cell Bold and increase the font size, click the Update formatting button for that new formatting to be applied to the corresponding data in the data table.
Show spreadsheet gridlines – Check or uncheck the Show spreadsheet gridlines checkbox to show or hide the gridlines in the data table. Note: this setting does not affect the gridlines that you see in the spreadsheet.
DATA INSERTION

The data table allows for multiple series of data insertion. At present there is only one type, the Position type, but more types will be added to this component in the future.
Series – In the Series property field, a default series (Series 1) is already selected. Add multiple series by clicking the plus button above the property field. As only one type of data insertion is currently available, there is no reason to have more than one series at present.
Name – Rename the selected series, if you wish, by entering a new name in the Name property field.
Type – Select the type of data insertion to use from the dropdown list:
Position – Each row of the Data Table component is identified by a position value. The first row (underneath the header) is position 1, the second row is position 2, and so on. Clicking each row will place its position value into the destination cell.
Source – Not required for the Position type.
Destination – For the Position type, select a single cell for the Position value to be entered into.
Last updated
Was this helpful?