> For the complete documentation index, see [llms.txt](https://learn.squirrel365.io/llms.txt). Markdown versions of documentation pages are available by appending `.md` to page URLs; this page is available as [Markdown](https://learn.squirrel365.io/tutorials/filtered-rows-insertion-building-a-filtered-selection.md).
# Filtered Rows Insertion: Building a Filtered Selection
When faced with a large dataset, it can be difficult to work through it all. Luckily, Squirrel offers just the solution – Filtered Rows data insertion.
You may have heard of, or even made use of, the Data Mover. Within this function, we offer many different insertion options one of which is Filtered Rows. If you haven’t had a chance to familiarise yourself, we have a [video on the Data Mover](https://squirrel365.gitbook.io/learn/functions/data-mover) in our Learn Section that introduces you to the function.
### What is Filtered Row insertion?
To sum it up, Filtered Row insertion allows you to sift through rows and rows of data, identify which cell you wish to filter by and return those rows in a second area of the spreadsheet.
### **Creating a Filtered Selection List**
In this article, we are going to walk through how to create a filtered list using a dropdown as the filter selector.
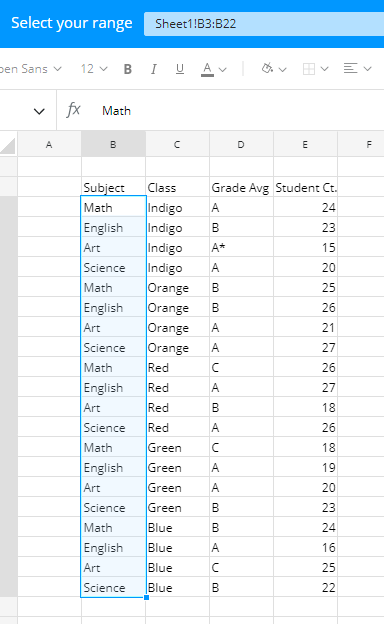
First, you need your data set. Simply import this into Squirrel under **File > Spreadsheet > Import**.
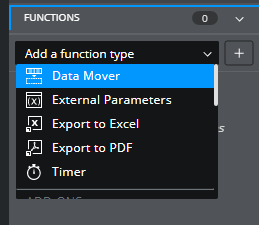
#### **Step 1 – Add the Data Mover**
Our first step is to add the Data Mover. You can do this by heading to the **Functions** drawer on the left side of the designer, expanding the dropdown, selecting “Data Mover” and pressing the “+” button to add.
#### **Step 2 – Add the Dropdown**
Next, add a Dropdown component to the canvas. This can be found under the Controls option on the left side panel where are components are located.
#### **Step 3 – Bind the Dropdown data**
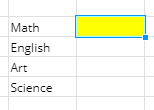
Within the Dropdown component properties, bind the List items to the spreadsheet cells where you have identified the values that you want to filter out of the dataset.

#### **Step 4 – Bind the Dropdown Data Insertion**
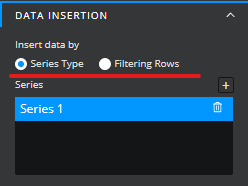
Once the list items are bound, expand the Data Insertion drawer in the properties panel. You will see a radio option for either Series Type or Filtering Rows. Maintain Series Type as the selection.
Ensure the Series Insertion type for the Dropdown is set to Label, and then bind the Destination to an empty cell in the spreadsheet. This will be the cell that will determine what rows are filtered out.
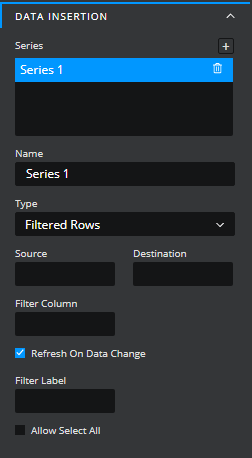
#### **Step 5 – Set up the Data Mover**
Moving back, select the Data Mover in the functions drawer once again. Expand the Type dropdown and select Filtered Rows. You will see the input boxes update in the properties panel.
Select and bind Source. Once the selector has expanded, select the entire dataset in the spreadsheet and then click ‘Confirm’.
#### **Step 6 – Bind the Filtered Row destination**
Next, bind the destination to a set of cells that will accommodate the filtered data. If this is difficult to determine, we suggest selecting a range in the spreadsheet that matches the Source range.
#### **Step 7 – Bind the Filter Column**
Afterward, bind the Filter Column input to the column in the spreadsheet that contains the values that you are using to filter the data. In this example, this is the column that contains all the different school subject types.
#### **Step 8 – Bind the Filter Label**
Finally, bind the Filter Label. The Filter Label is the cell that is used to determine what data is filtered into the destination cells – this is the same cell that we bound the Dropdown data insertion destination to earlier.
#### **Step 9 – Time to Test!**
Now that we are all set up, it’s time we make sure it works.
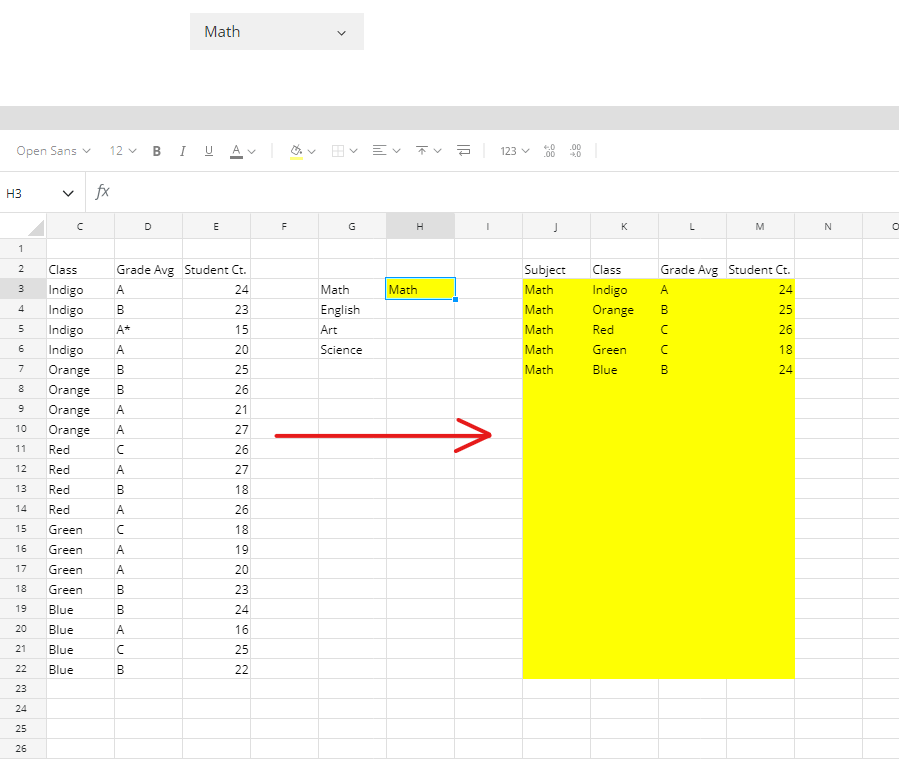
Head into Debug and interact with the Dropdown component. Select the first item in the dropdown and watch what happens in the spreadsheet.
You will see that that data from the original data set has been filtered down into the destination range based on the criteria set when you chose an item in the dropdown.